![]() https://www.geospatialecology.com
https://www.geospatialecology.com
Environmental Monitoring and Modelling
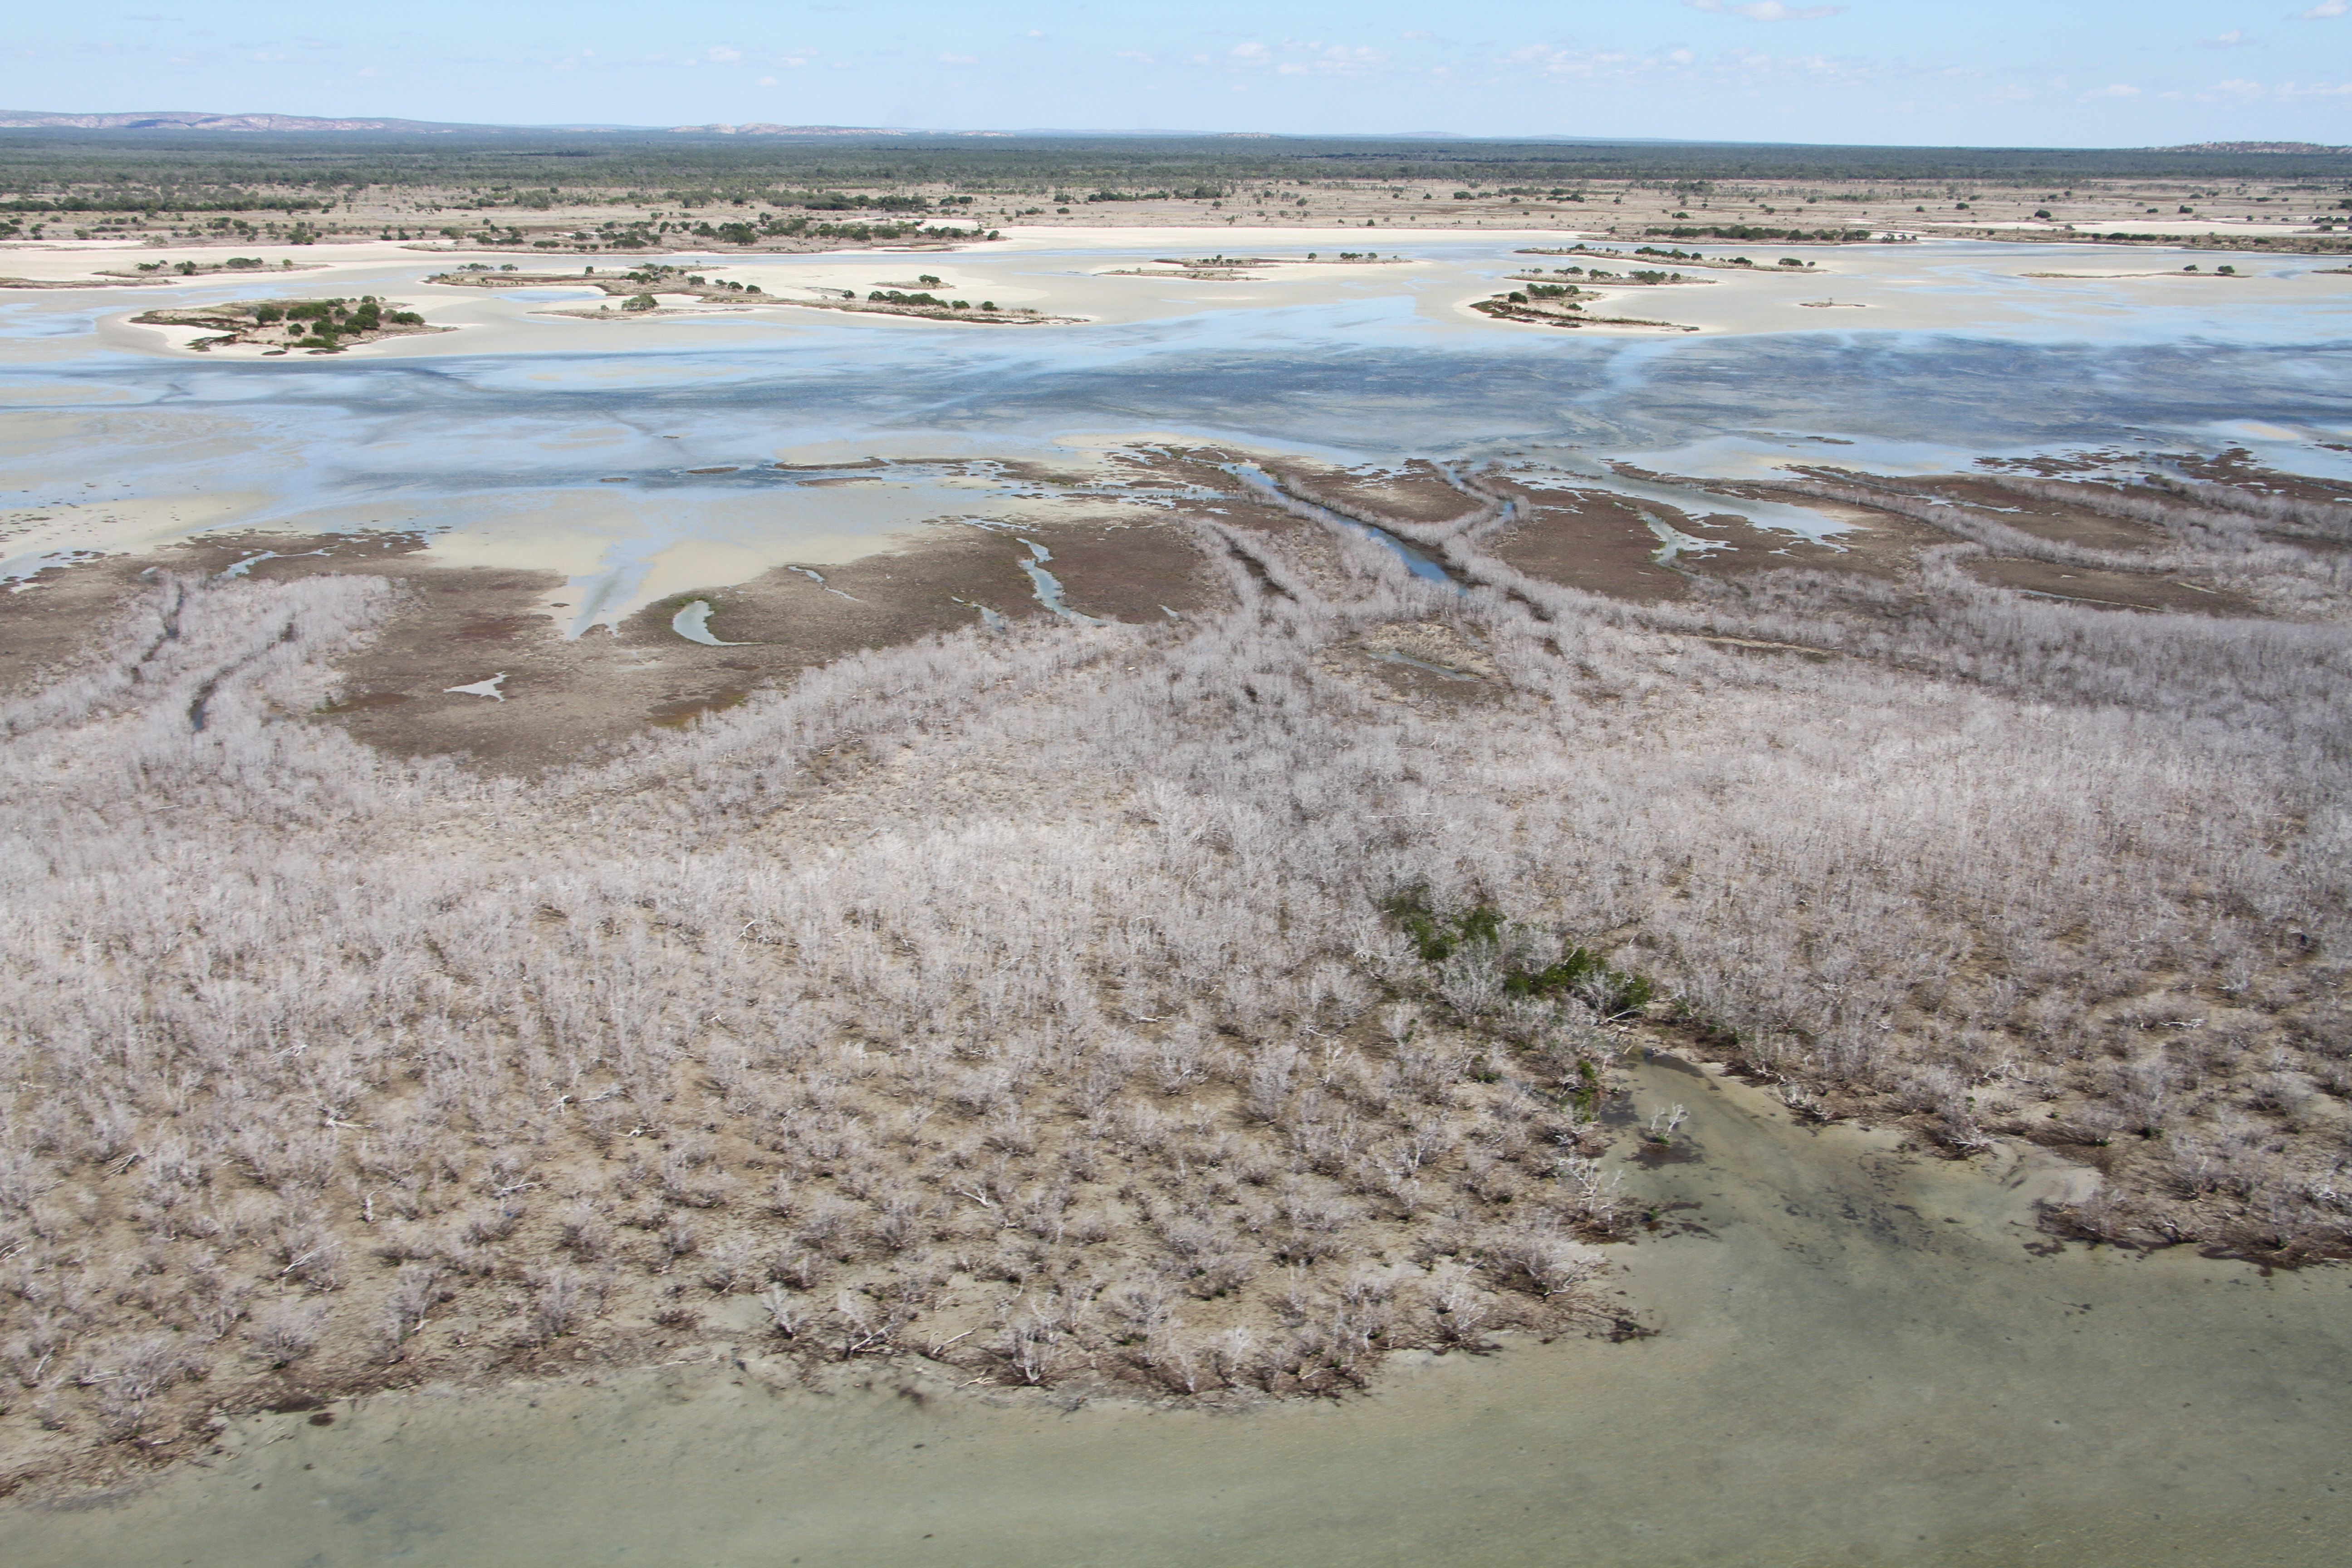
Monitoring challenge - Understanding mangrove die-back in the Gulf of Carpentaria
Australia is home to 7% of the world’s mangroves, with the majority located in the tropical regions of northern Australia. During the southern hemisphere summer of 2015–16, one of the worst mangrove dieback events ever recorded impacted approximately 7400 hectares of mangrove forests along more than 1000 km of Gulf of Carpentaria coastline.
Research under the umbrella of the National Environmental Science Programme (NESP) has noted that there is little understanding of the patterns of impact across the extent of dieback – in some areas, all mangrove species in all tidal elevations have been affected, but in other areas only some species in specific locations have been affected.
In order to better understand the causes of the die-back, and untangle long-term degradation from discrete disturbance events, we need to quantify mangrove condition over time and in a spatially explicit manner.
A recent field survey in the region highlighted further degradation stemming from two severe cyclones in the region in late 2018 and early 2019. Details of this survey were recently covered in the press.
Your task
Using the skills you have developed during this course, your task is to assess the temporal dynamics of mangrove condition from 2013 to present. The primary aim is to determine if long-term trends in condition are observable from space over time, and if discrete disturbance events can be detected.
The specific objectives are to:
- identify publicly available remote sensing datasets of the appropriate scale and resolution for monitoring mangrove condition and environmental conditions over time
- quantify the inter- and intra-annual variability in mangrove condition at 8 specified locations along the Gulf (location details below)
- analyse temporal trends in mangrove condition at these 8 sites and determine the extent to which they are correlated with environmental factors (eg. temperature, rainfall)
- identify which of the 8 sites were impacted by the 2018-2019 cyclone season, and on which dates
Study locations
Coordinates of the 8 areas of interest will be provided during the Intensive Practical week.
| Location | State | Code | Longitude | Latitude |
|---|---|---|---|---|
| Limmen | NT | 1A | 135.78877 | -15.146215 |
| Limmen | NT | 1B | 135.836993 | -15.171145 |
| Mule | NT | 2A | 136.434148 | -15.647369 |
| Mule | NT | 2B | 136.441971 | -15.650919 |
| Karumba | QLD | 4A | 140.853576 | -17.422561 |
| Karaumba | QLD | 4B | 140.896250 | -17.340024 |
| Mitchell | QLD | 5A | 141.665424 | -15.027324 |
| Mitchell | QLD | 5D | 141.660919 | -14.996538 |
Tip: Within Google Earth Engine you can define a point geometry Feature using the approach show below:
var site1A = ee.Geometry.Point([135.78877, -15.146215]);
Assessment format
Complete the image processing and spatio-temporal analysis required to address the monitoring challenge that you have been tasked with, and construct a scientific report to communicate your findings.
Students will be required to complete this work outside of the hours that have been allocated for the intensive mode practical delivery, but we will dedicate one afternoon to starting the assignment.
Your final report should be formatted as a submission to the scientific journal Remote Sensing using this Word template or this LaTex template. If you have not used LaTex before, use the Word template and chat to me if you interested in learning LaTeX.
- Abstract - 250 word summary
- Introduction – include a brief literature review on the problem at hand, the aims and objectives
- Methods - include descriptions of datasets, processing steps and analysis applied
- Results - include appropriate maps, tables and charts to illustrate your findings
- Discussion - discuss your findings (linking back to the objectives) including any limitations of the study and suggestions for improvement
- Conclusion - succinct summary of main findings
- References
- Reports should not exceed 3000 words
Students should also refer closely to the grading criteria (ENV306 and ENV506) when writing this report.
GEARS - Geospatial Ecology and Remote Sensing - https://www.geospatialecology.com
(c) Shaun R Levick